Generate random genes as GRanges
Generating random genome annotations
For different purposes, I often need to create random gene/features annotations.
I usually need these annotations as a GRanges object (see the
GenomicRanges package).
I searched a bit on the internet but couldn’t really find what I was looking for.
I want to be able to control the following parameters:
- Number of genes
- Gene sizes (~gaussian distribution with upper and lower bounds as parameters)
- Number of chromosomes
- Chromosomes' length
I will assign to each chromosome a number of gene that is proportional to the chromosome length (so all chromosome have ~equal gene densities).
First I need 2 functions:
- A function that generates random (and unique) gene names
- A function that generates gene lengths (or ‘sizes’) within defined boundaries
Function to generate random gene names
I basically copy/pasted a solution found on this stackoverflow post. I just modified it slightly to ony allow letters (and not numbers) in gene names in order to simplify the definition of the length (number of characters) of gene names, which will be automatically defined based on the gene number.
idGenerator <- function(n, lengthId) {
    idList <- stringi::stri_rand_strings(n,
                                         lengthId,
                                         pattern = "[A-Za-z]")
    while(any(duplicated(idList))) {
         idList[which(duplicated(idList))] <-
           stringi::stri_rand_strings(sum(duplicated(idList), na.rm = TRUE),
                                      lengthId,
                                      pattern = "[A-Za-z]")
         }
    return(idList)
    }
Function to generate random gene width/sizes
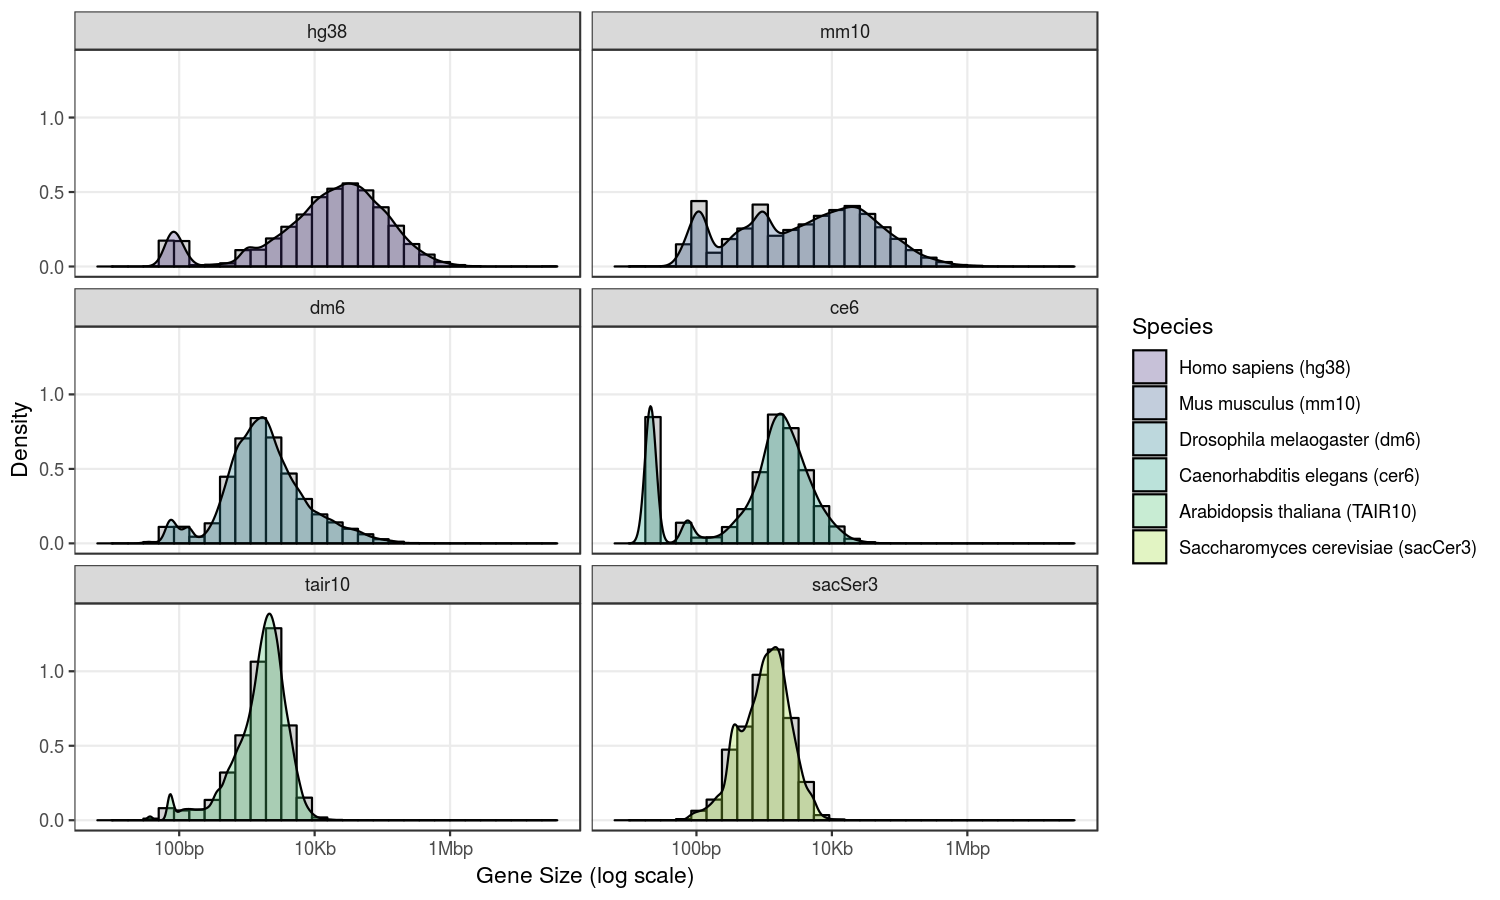
Gene size distribution heavily depends on the species. For example here is the distribution of gene annotations for 6 species:
#Load libraries
library(tidyverse)
library(TxDb.Hsapiens.UCSC.hg38.knownGene)
library(TxDb.Athaliana.BioMart.plantsmart25)
library(TxDb.Dmelanogaster.UCSC.dm6.ensGene)
library(TxDb.Mmusculus.UCSC.mm10.ensGene)
library(TxDb.Scerevisiae.UCSC.sacCer3.sgdGene)
library(TxDb.Celegans.UCSC.ce6.ensGene)

txdb <- list()
txdb[["hg38"]] <- TxDb.Hsapiens.UCSC.hg38.knownGene
txdb[["mm10"]] <- TxDb.Mmusculus.UCSC.mm10.ensGene
txdb[["dm6"]] <- TxDb.Dmelanogaster.UCSC.dm6.ensGene
txdb[["ce6"]] <- TxDb.Celegans.UCSC.ce6.ensGene
txdb[["tair10"]] <- TxDb.Athaliana.BioMart.plantsmart25
txdb[["sacSer3"]] <- TxDb.Scerevisiae.UCSC.sacCer3.sgdGene

#Get gene size and arange as a data.frame
gnw <- reshape2::melt(lapply(txdb,
                             function(x) width(genes(x))),
                      value.name = "GeneSize") %>%
       dplyr::mutate(Species = factor(L1,
                                      levels = names(txdb),
                                      ordered = TRUE))

# Personalize colors and labels
mycols = viridis::viridis(8)[-c(1,8)]
names(mycols) <- names(txdb)
mylabs <- c("Homo sapiens (hg38)", "Mus musculus (mm10)",
            "Drosophila melaogaster (dm6)", "Caenorhabditis elegans (cer6)",
            "Arabidopsis thaliana (TAIR10)", "Saccharomyces cerevisiae (sacCer3)")
names(mylabs) <- names(txdb)

# Plot distributions:
ggplot(gnw, aes(x=log10(GeneSize), fill=Species)) +
    geom_histogram(aes(y=..density..),
                   colour="black", fill="lightgrey") +
    geom_density(alpha=.3) +
    scale_fill_manual(values = mycols,
                      labels = mylabs) +
    scale_x_continuous(breaks = c(2, 4, 6),
                       labels = c("100bp", "10Kb", "1Mbp")) +
    labs(x = "Gene Size (log scale)",
         y = "Density") +
    theme_bw() +
    theme(panel.grid.minor = element_blank()) +
    facet_wrap(vars(Species), nrow=3)
Although it probably does not reflect a “natural” situation, I decided to define gene sizes based on a Gaussian distribution with a choice of a minimum and a maximum gene size.
widthGenerator <- function(n, minWidth, maxWidth) {
    if (maxWidth<=minWidth) stop("maxWidth should be < minWidth")
    meanWidth <- minWidth + sqrt(maxWidth*minWidth) # take geometrical mean to limit the impact of high maxWidth
    sdWidth <- floor((maxWidth-meanWidth)/3)
    wdList <- round(rnorm(n, meanWidth, sdWidth))
    isOutOfRange <- (wdList<minWidth | wdList>maxWidth)
    while(any(isOutOfRange)) {
        wdList[isOutOfRange] <- round(rnorm(sum(isOutOfRange),
                                            meanWidth,
                                            sdWidth))
        isOutOfRange <- (wdList<minWidth | wdList>maxWidth)
    }
    return(wdList)
}
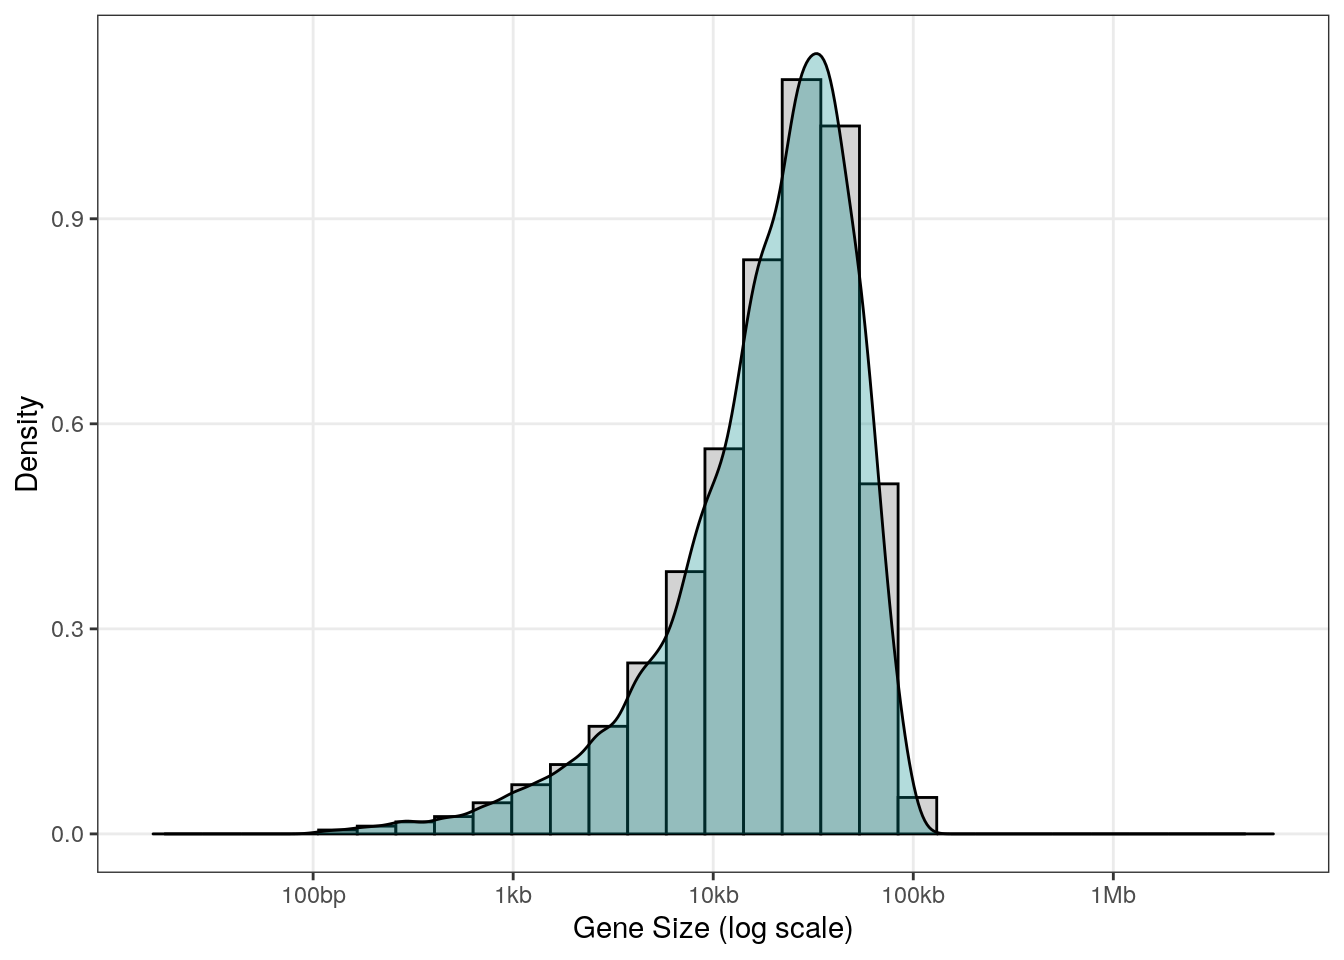
Here is what we generate with some relatively usual parameters (gene size betwen 100bp and 100Kb):
df <- data.frame(GeneSize = widthGenerator(1e4, 100, 1e5))

ggplot(df, aes(x=log10(GeneSize))) +
    geom_histogram(aes(y=..density..),
                   colour="black", fill="lightgrey") +
    geom_density(alpha=.3, fill = "darkcyan") +
    scale_x_continuous(limits = c(1.2, 6.8),
                       breaks = c(2, 3, 4, 5, 6),
                       labels = c("100bp", "1kb", "10kb", "100kb", "1Mb")) +
    labs(x = "Gene Size (log scale)",
         y = "Density") +
    theme_bw() +
    theme(panel.grid.minor = element_blank())
Function to generate random genes
Now the function that generates random genes as GRanges, using the 2 previous functions above:
CreateGR <- function(ng=1e4, nchr=1, chromlength=1e4, widthMin=100, widthMax=1e4) {
## ng: number of genes
## nchr: number of chromosomes
## withMin/WidthMax: min/max gene size
## chromLength: vector of chromosome lengths

# Check
if (length(chromlength) != nchr) {
    stop("length(chromlength) is not equal to number of chromosomes (nchr)")
}

#Number of genes on each chromosome
##Proportion of the genome for each chromosome
ChromProp <- chromlength/sum(chromlength)
##Number of genes per chromosome
GeneNumberByChr <- round(ChromProp*ng,0)
if (sum(GeneNumberByChr) != ng) {
    GeneNumberByChr[1] <- GeneNumberByChr[1] + ng - sum(GeneNumberByChr)
}

#Chromosomes
chrNames <- paste0("chr", 1:nchr)
gnChr <- S4Vectors::Rle(rep(chrNames,
                            times=GeneNumberByChr))

#Strands
gnStrand <- S4Vectors::Rle(sample(c("+", "-"),
                                 size = ng,
                                 replace = TRUE))

#Ranges
##Gene names
gnLength <- ceiling(log(ng) / log(26)) + 1
gnNames <- idGenerator(ng, gnLength)

## start values (even with MaxWidth the genes won't go beyond chromosome borders)
gnStart <- unlist(mapply(sample,
                         lapply(chromlength,
                                function(x){(widthMax+1):(x-widthMax-1)}),
                         GeneNumberByChr,
                         list("replace" = TRUE)),
                  use.names = FALSE)

#Gene widths
gnWidth <- widthGenerator(ng,
                          maxWidth=widthMax,
                          minWidth=widthMin)

GR <- GenomicRanges::GRanges(seqnames = gnChr,
                             ranges = IRanges::IRanges(start = gnStart,
                                                       width = gnWidth,
                                                       names = gnNames),
                             strand = gnStrand)
GenomeInfoDb::seqinfo(GR) <- GenomeInfoDb::Seqinfo(seqnames = chrNames,
                                                   seqlengths = chromlength,
                                                   isCircular = rep(FALSE, length(chrNames)),
                                                   genome = "mock")
return(GR)
}
Using the following parameters, the function generates a GRanges in ~30 nanoseconds:
chromSizes <- c(30427671, 19698289, 23459830, 18585056, 26975502) # from A. thaliana genome
CreateGR(1e5, nchr=5, chromlength=chromSizes)
## GRanges object with 100000 ranges and 0 metadata columns:
##         seqnames            ranges strand
##            <Rle>         <IRanges>  <Rle>
##   SAmvd     chr1 29194029-29199925      -
##   sPWlf     chr1 29738130-29742506      +
##   OeOyx     chr1   4094438-4099100      -
##   iDJdJ     chr1 25695446-25695917      -
##   QrgNb     chr1   7424826-7430143      -
##     ...      ...               ...    ...
##   BYNer     chr5   4638035-4640168      -
##   Wqhxl     chr5 23896448-23903443      +
##   NwlQQ     chr5 21284011-21286015      -
##   mwQvN     chr5   9237160-9244238      +
##   obPRS     chr5   8099106-8101112      -
##   -------
##   seqinfo: 5 sequences from mock genome
Pascal GP Martin
Senior Research Specialist (IR1) at INRAE
Research Specialist in Genomics and Bioinformatics