Plotting SRA database growth
The
Sequence Read Archive is NCBI’s database for high throughput sequencing data and the largest public repository for such data.
The data on the growth of the database is available
here
Load packages
suppressPackageStartupMessages(library(magrittr))
suppressPackageStartupMessages(library(httr))
suppressPackageStartupMessages(library(ggplot2))
Function to make nicer axis labels
scientific_10 <- function(x) {
  xx <- dplyr::case_when(x>=0 & x<=100 ~ as.character(x),
                         x>100 & log10(x)%%1==0 ~ gsub(".+e\\+", "10^", scales::scientific_format()(x)),
                         TRUE ~ gsub("e\\+", " %*% 10^", scales::scientific_format()(x)))
  parse(text = xx)
}
Download the data in R
sraurl <- "https://www.ncbi.nlm.nih.gov/Traces/sra/sra_stat.cgi"

sra <- httr::GET(url=sraurl) %>%
        httr::content(encoding="UTF-8")

sra$date <- as.Date(sra$date, format = "%m/%d/%Y")
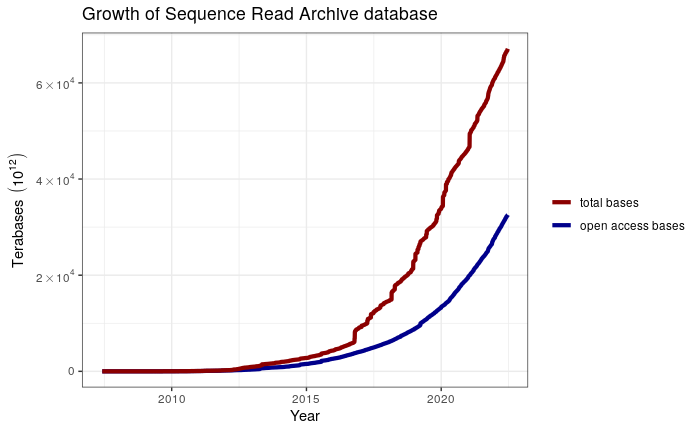
Plot with linear scale
sra %>%
  dplyr::select(date, bases, open_access_bases) %>%
  tidyr::pivot_longer(cols = 2:3, names_to = "type", values_to = "terabases") %>%
  dplyr::mutate(terabases = terabases / 1e12) %>%
  dplyr::mutate(type = dplyr::case_when(type == "bases" ~ "total bases",
                                 type == "open_access_bases" ~ "open access bases")) %>%
ggplot(mapping = aes(x = date, y = terabases, color = type)) +
  geom_line(size = 1.5) +
  scale_color_manual(name = NULL,
                     values = c("total bases" = "darkred",
                                "open access bases" = "darkblue")) +
  scale_y_continuous(labels = scientific_10 ) +
  labs(x = "Year", y = expression( Terabases~(10^12) ),
       title = "Growth of Sequence Read Archive database") +
  theme_bw() +
  NULL
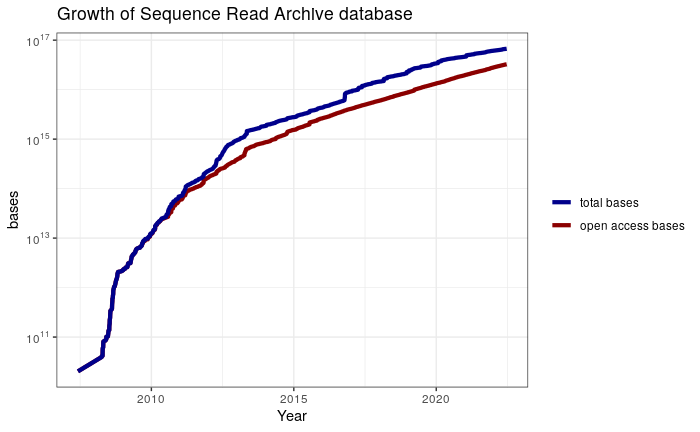
Plot with log scale
sra %>%
  dplyr::select(date, bases, open_access_bases) %>%
  tidyr::pivot_longer(cols = 2:3, names_to = "type", values_to = "bases") %>%
  dplyr::mutate(type = dplyr::case_when(type == "bases" ~ "total bases",
                                 type == "open_access_bases" ~ "open access bases")) %>%
ggplot(mapping = aes(x = date, y = bases, color = type)) +
  geom_line(size = 1.5) +
  scale_color_manual(name = NULL,
                     values = c("total bases" = "darkblue",
                                "open access bases" = "darkred")) +
  scale_y_log10(labels = scientific_10 ) +
  labs(x = "Year", y = "bases" ,
       title = "Growth of Sequence Read Archive database") +
  theme_bw() +
  NULL
Pascal GP Martin
Senior Research Specialist (IR1) at INRAE
Research Specialist in Genomics and Bioinformatics